Visiopharm Multiplex Phenotyping Software
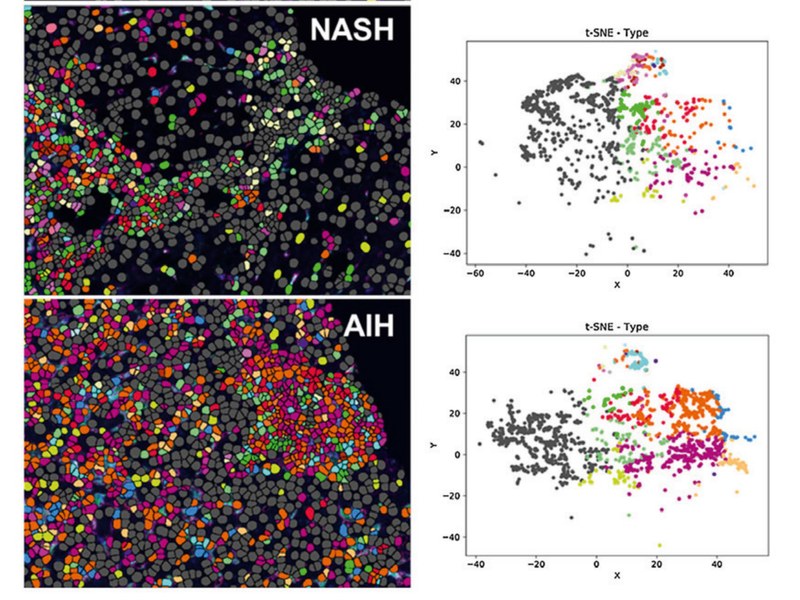
Model: Multiplex PhenotypingWith more than 40 markers in a single multiplex immunofluorescence image, manual reading is slow and hard to reproduce. The Visiopharm Multiplex Phenotyping module segments cells with deep learning, clusters high-dimensional signal into biologically meaningful phenotypes automatically, and answers "which cells are here, and who sits next to whom" with t-SNE, heatmaps and neighbourhood matrices. Supports H&E, single and multiplex IHC, multiplex IF and IMC, and imports more than 200 image layers.
Specifications
| Staining support | H&E, single-plex IHC, multiplex IHC, multiplex IF, IMC (metal-tagged imaging) |
|---|---|
| Channels | All IF modalities, more than 200 channels |
| Image layers | Import over 200 image layers with automatic name transfer |
| High-plex capacity | 40+ biomarkers analysed together; 50 channels demonstrated |
| Cell segmentation | Deep-learning segmentation on DAPI / Hoechst / Iridium nuclear channels |
| Phenotype detection | Automatic clustering from intensity thresholds and segmentation, with manual merge and redefine |
| Intensity normalisation | Per-band normalisation removes staining batch and exposure differences |
| Visualisation | t-SNE plot, marker heatmaps, phenotype matrix, phenotype profile, neighbourhood matrix |
| Spatial analysis | Neighbourhood matrix quantifies spatial proximity and interaction between phenotypes |
| Data export | .csv / .tsv, ready for R, Python or downstream statistics |
| Imaging compatibility | Akoya Vectra 3 multispectral, Fluidigm Hyperion (IMC), Ultivue kits |
| Ready-to-use apps | 120+ RUO analysis apps, 7 CE-IVD apps |
| Deployment | Workstation, server or network (cloud) installation |
Features
- 40+ biomarkers analysed together: manual reading cannot keep up with high-plex data, and automated clustering sets one consistent standard
- Deep-learning cell segmentation on DAPI or Iridium nuclear channels stays robust across intensity, size and morphology differences, separating even densely packed cells
- Absolute and relative thresholds coexist: each channel can be set independently, so cross-batch comparison no longer depends on eyeballing windows
- Normalisation before clustering removes false phenotypes caused by staining batches and exposure differences
- Automatic phenotype clustering with manual refinement: merge, rename and redefine clusters according to biological meaning
- Five visualisation components: t-SNE, marker heatmaps, phenotype matrix, phenotype profile and neighbourhood matrix, from dimensionality reduction to spatial relationships
- Spatial proximity analysis answers questions such as how close CD8+ T cells sit to Tregs — something only possible from the original image
- Open data output: results export to csv / tsv for R, Python or existing bioinformatics pipelines
- Compatible with mainstream high-plex platforms: Akoya Opal, IMC metal-tagged imaging and Ultivue kits
- Two regulatory foundations: 120+ RUO apps and 7 CE-IVD apps, covering both exploratory and compliant workflows
Applications
- Tumour microenvironment: immune subsets, spatial distribution and cell-cell interaction
- Immuno-oncology: response prediction, responder versus non-responder analysis
- Biomarker discovery: high-plex screening and candidate validation
- Drug development: target expression profiles, pharmacodynamics and resistance mechanisms
- Chronic liver disease: macrophage phenotype profiles across HCV, NASH and autoimmune hepatitis
- Methodology: standardisation and reproducibility of multiplex IHC / IF quantification